BALTIMORE – Maryland student scores held steady on the National Assessment of Educational Progress (NAEP) for 2017, while including more students with disabilities (SWD) and English learners (EL).
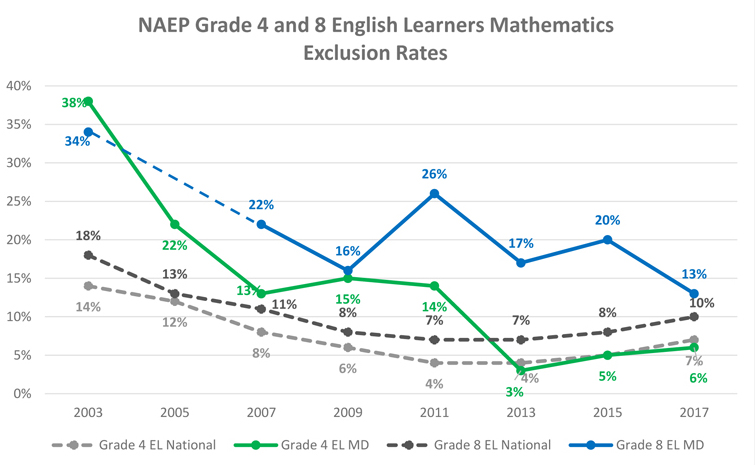
Long criticized for a high number of students excluded from the NAEP testing population, Maryland has dramatically changed course. For the first time, the State met federal participation targets for both students with disabilities and English learners for each subject in both tested grades. Just four years ago, some exclusion rates were above 60 percent.
“It is important that all of Maryland’s students be counted in any assessment to give us a clear view of how well our schools and students are doing,” said Dr. Karen Salmon, State Superintendent of Schools. “Our school systems have met the challenge, and yet this change in the tested population did not dramatically shift outcomes.”

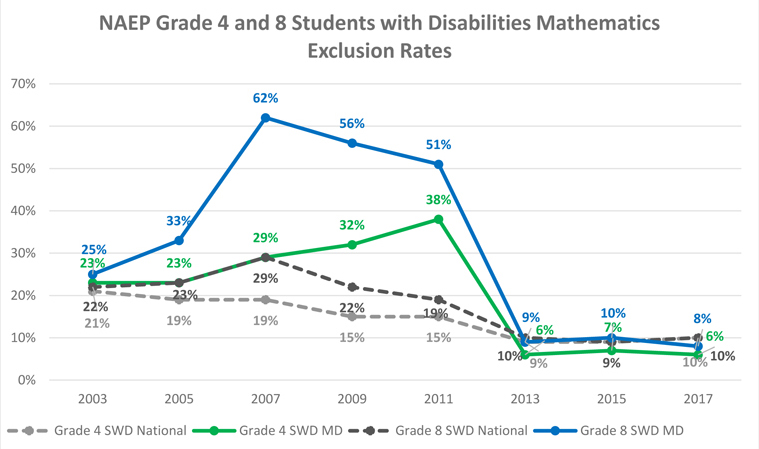
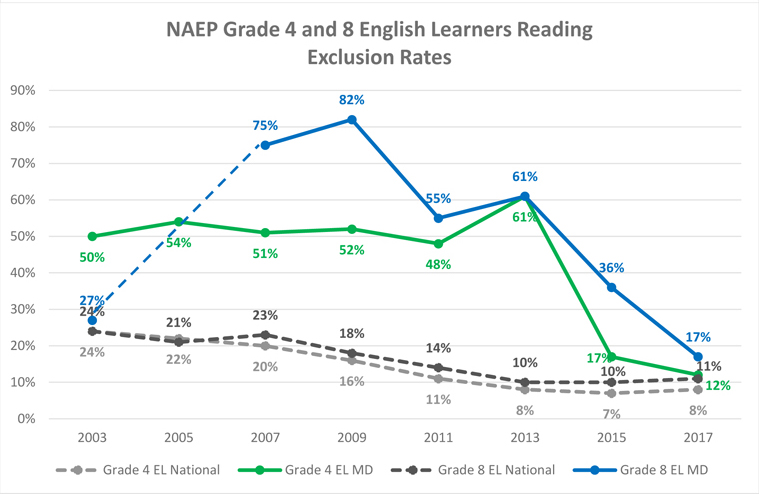
Note: -------- Reporting standards not met nationally in 2005 for English Learning student group. Sample size for that year is insufficient to permit a reliable estimate.
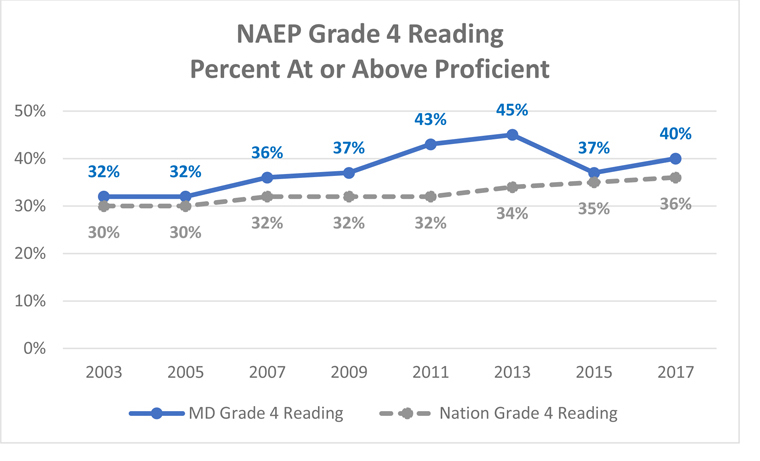
Fourth Grade Reading
The percentage of Maryland students scoring at or above the proficient level is at 40 percentage points, an increase of 8 percentage points since 2003. Nationally, scores improved six percentage points since 2003. The average fourth grade reading score in Maryland improved two points on the 500-point scale since 2015, from 223 to 225. Since 2003, the average Maryland public school score is up six points. This compares to a national increase of five points, rising from 216 to 221.
Eighth Grade Reading
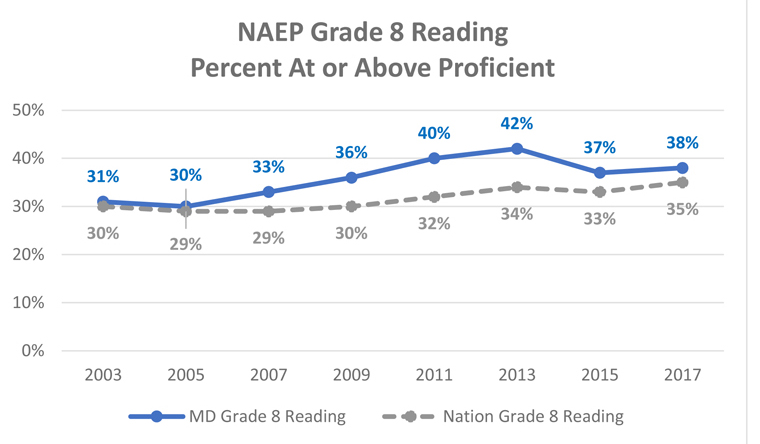
The percentage of Maryland students scoring at or above the proficient level has increased seven percentage points since 2003 compared to a national improvement of five percentage points. The percentage of Maryland students scoring at or above proficient improved one point between 2015 and 2017. The average Maryland eighth grade reading score fell one point between 2015 and 2017 to 267, while the national average score increased one point to 265. Maryland’s average public school score has increased five points—from 262 to 267—since 2003, compared to a national score increase of four points—261 to 265.
Fourth Grade Mathematics
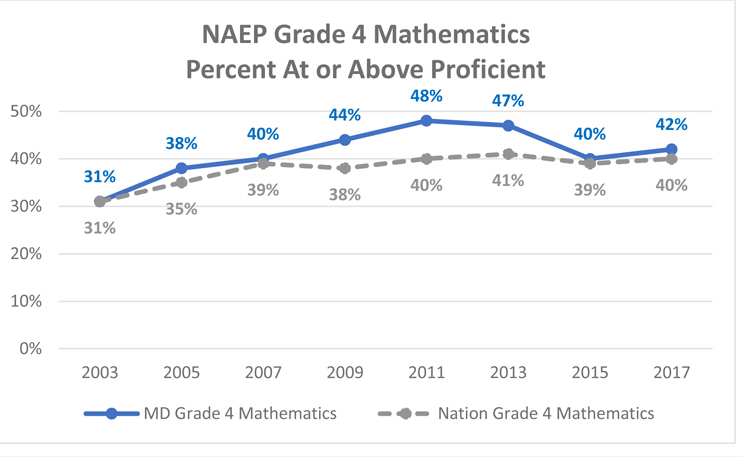
The percentage of Maryland students scoring at or above the proficient level in fourth grade math has improved 11 percentage points since 2003, from 31 percent to 42 percent, compared to national improvement of nine percentage points. The average Maryland public school test score on fourth grade mathematics improved from 239 to 241 since 2015. Since 2003, the average Maryland score has increased eight points. This compares to the average national score improvement of five points, from 234 to 239.
Eighth Grade Mathematics
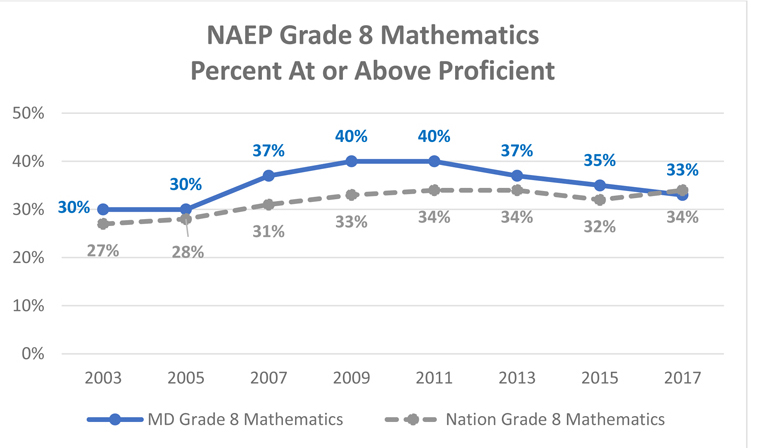
The percentage of Maryland students scoring at or above the proficient level on the eighth grade mathematics exam has increased three percentage points since 2003, from 30 to 33 percent, compared to national improvement of seven percentage points. The average Maryland public school score fell two points between 2015 and 2017, from 283 to 281. Since 2003, the average Maryland score has increased three points. This compares to an increase in the average national score of six points, from 276 to 282.
NAEP, also known as the Nation’s Report Card, tests a sample of fourth- and eighth-grade students on reading and mathematics every two years. The test is a congressionally authorized project sponsored by the U.S. Department of Education through the National Center for Education Statistics. Students are tested on standards that differ in both content and sequencing from the Maryland College and Career-Ready Standards.
NAEP scores are available at:
https://nces.ed.gov/nationsreportcard/